BizBench : Home

How to Present BizBench Reports

Present BizBench Reports

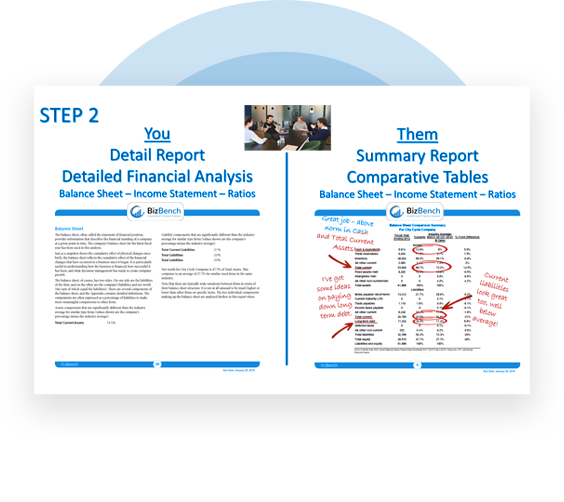
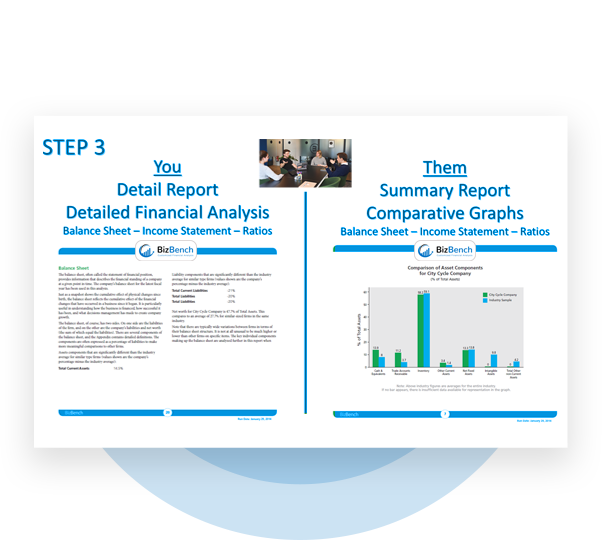
Briefly, The key to presenting BizBench Reports in a complete paid consultation with a client, or internally with your staff, is to keep it as simple, yet direct, for them by taking them through the Summary Report; while you have the added detail of the Detailed Report to present from and back up everything you consult them on.


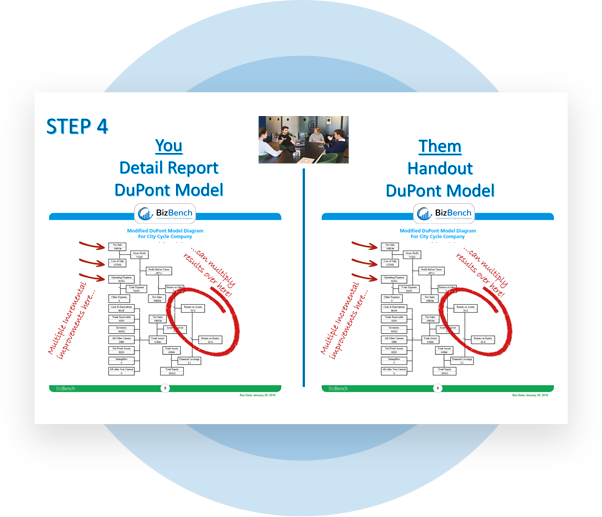
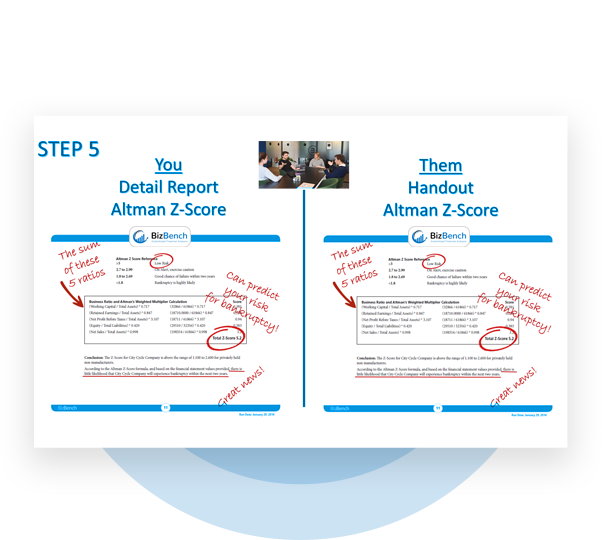
Preparation is simple but important. If you have a moment, mark up their Summary Report with highlights and simple notes. This will show them you’ve given it some thought, and more importantly, it will be more YOUR report and less a BizBench report. Claim it with notes.

The Summary Report is only 17 pages, and most of the strengths/weaknesses stand out, particularly in graphic format. Keep them focused on the graphs as much as possible while presenting, since they are the most telling about where the opportunities for growth are. You use the Detailed Report.


Preparation is important. Take a few minutes to go through the Detailed Report and highlight the points you determine to be the most important and relevant for your client.

Review the comparative tables with them looking at the tables, and you referring to the Analysis Detail for each KPI as you work through tables and graphs. The Analysis Detail will have all the points for each KPI comparison you will need, though you may think of additional points to make.

As you proceed with the DuPont Model, Altman Z-Score, and Ratio Area Averages Analysis, provide them a handout of the graphic portion of each, and refer to the written analysis included in the Detailed Report for each as you present these three powerful analytical tools.

Make sure you have addressed their areas of strength first, and the good news that you will find in the report. Make sure to address your concerns with where the business is lagging compared to industry norms. It’s imperative that they accept these conclusions in order for them to own up to the need to improve their business in the areas of concern and save them from bigger problems down the road – even business failure.


Once they have accepted the scope of their current position, and the seriousness of addressing areas where they are weak….

Then, Present Where They Can Be

Two important tools here to use:

Using the DuPont Model, and giving them a copy, let them see how the numbers all relate. Using the DuPont Model Scenario Calculator, you can consult with them what changes to general improvements are needed in Balance Sheet and Income Statement KPIs to get them to the top 10% number for their industry in Return on Assets and Return on Equity.

Run a BizBench Scenario Report, where you can show them in the same BizBench format, where they would rank with the changes.

Lastly, Present Possible Actions and Build an Action Plan

Using the Discussion Ideas, present to them the solutions you feel will bring them the greatest change, in the shortest time, with the least expense of time and money. As you present and work through with your client the most relevant Discussion Ideas, they should be creating their ACTION PLAN using the ACTION PLAN WORKSHEET. This assures they own the plan.


Focus on two or three short term, say within the next 7-30 days. There may be some long term actions that may require a larger investment in time and money, but that are also necessary, or at least well advised. You can help them see how to fund these with savings and added revenue from the easy fixes. This should be a collaborative effort so they will be accountable for their role in their business improvement action plan and own it. Work together to create at least a 30, 60, and 90 day plan, with a more in-depth review in 90 days. Follow up in subsequent meetings to make sure the action plan is being implemented, even repeating this entire process at least quarterly.

Start today to use BizBench Reports to guide your clients to the Top 10% of their industry!

Purchase it Now & Save!

Buy Now

1 Month Access

Business Owner/Executive

$495.00
  • User is able to access detail and summary report
  • User is able to access word and PDF formats
  • User is able to create one business
  • User is able to have support with the bizbench team if he/she needs help
  • User is able to have internet accessibility
Choose

1 Year Access Course and Support

Accountant/Consultant

Best Value
$1,490.00
  • User is able to see the detail and summary report
  • User is able to access the word and PDF formats
  • User is able to have unlimited clients in their business
  • User is able to have training and support with the bizbench team if he/she d’nt understand
  • User is able to have internet accessibility
Choose

1 year Access

Business Owner/Executive

Best Value
$795.00
  • User is able to access the detail and summary report
  • User is able to access the word and PDF formats
  • User is able to have unlimited clients in their business
  • User is able to have coaching,training and support with the bizbench team if they d’nt understand the business
  • User is able to have internet accessibility
Choose

1 month Access

Business Owner/Executive
$ 495
  • Detail and Summary Report
  • Word and PDF Formats
  • One Business
  • Support
  • Internet Accessible

1 Year Access
Course and Support

Accountant/Consultant
$ 1490
  • Detail and Summary Report
  • Word and PDF Formats
  • Unlimited Clients
  • Training and Support
  • Internet Accessible

1 year Access

Business Owner/Executive
$ 795
  • Detail and Summary Report
  • Word and PDF Formats
  • Unlimited Clients
  • Coaching, Training and Support
  • Internet Accessible

BizBench Reports benchmark a business against similar businesses in the same NAICS code in 51 key financial metrics using the extensive database of hundreds of thousands of businesses throughout North America.

Contact Us

12441 South 900 East #120 Draper, Utah 84020