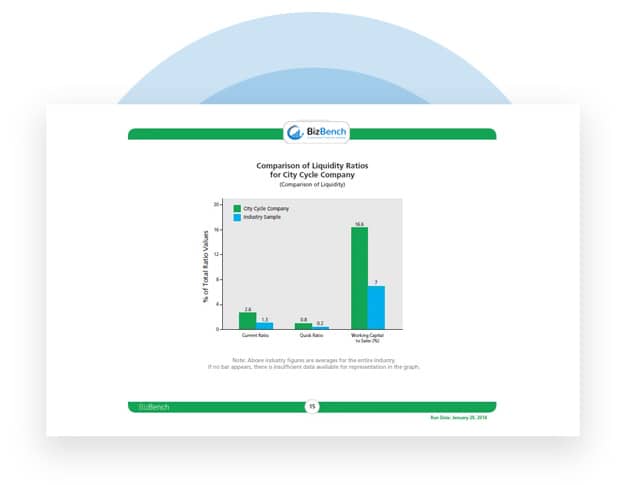
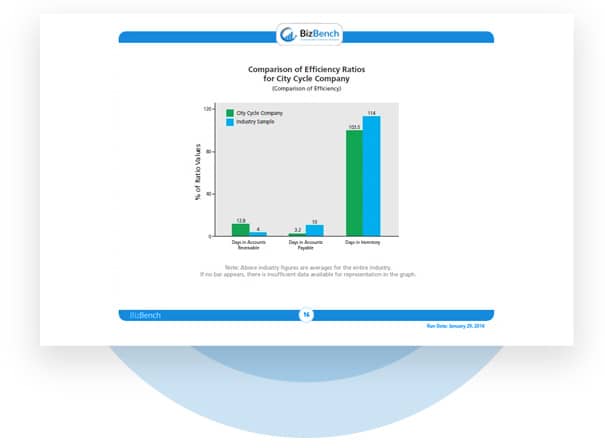
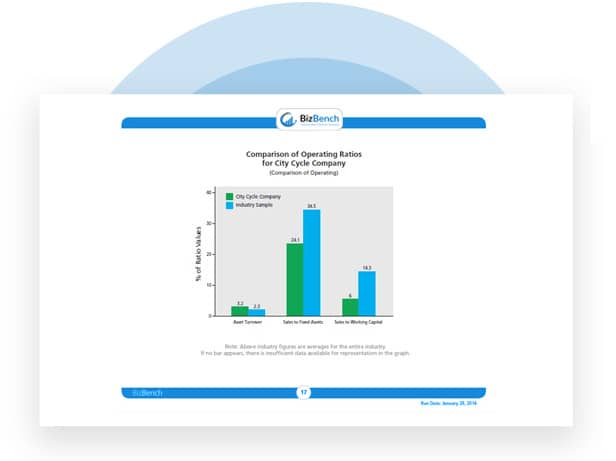
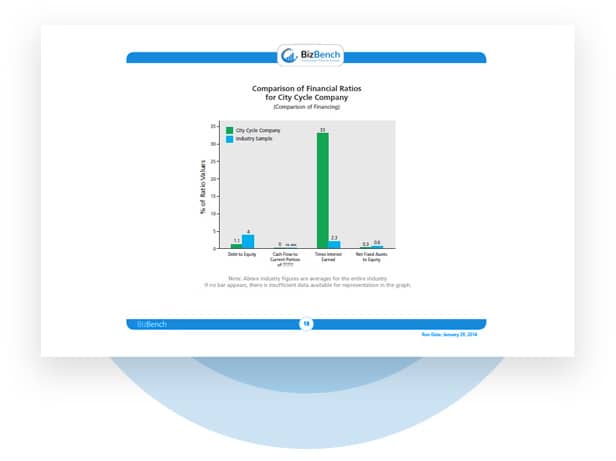
Financial Ratios Comparison Graphs
BizBench also graphs each of the 19 financial ratio comparisons. These ratios are already normalized, so these graphs are the actual ratios compared to industry standard. The ratios are grouped and graphed for each category – Liquidity Ratios, Efficiency Ratios, Operating Ratios, Financing Ratios, and Profitability Ratios.
Feel free to review the data below and see what it tells you about City Cycle. What would your client or management team learn from your presentation of these graphs?