BizBench : Home

Financial Ratios Comparison Chart

Financial Ratios Comparison Chart

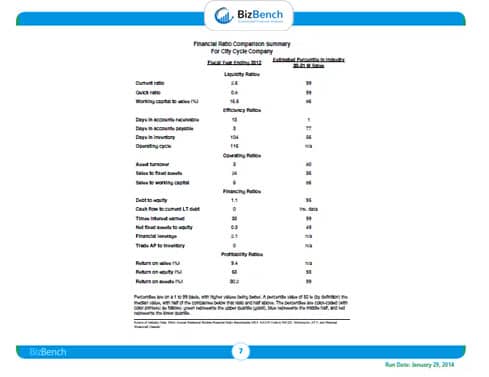
The Financial Ratios Comparison Chart benchmarks the business by percentile compared to industry standard for each of 19 ratios across 5 categories – Liquidity Ratios, Efficiency Ratios, Operating Ratios, Financing Ratios, and Profitability Ratios, as shown below in this sample.

You can see that City Cycle scores in the 99th percentile for Current Ratio, so their liquidity position is strong. Yet improvement is needed in Days in Accounts Receivable, and payables could be held longer as they score in the 77th percentile for Days in Accounts Payable, to improve cash flow. What else do you see?

BizBench Reports benchmark a business against similar businesses in the same NAICS code in 51 key financial metrics using the extensive database of hundreds of thousands of businesses throughout North America.

Contact Us

12441 South 900 East #120 Draper, Utah 84020